




Most weekly-options backtests in India run from 2019 to today. Between October 2024 and April 2026, the instrument those backtests describe changed nine times. Contract sizes tripled, weekly products disappeared, the expiry day moved and the cost of trading rose. We tested whether those changes show up in the results of a simple weekly strategy. They do not, and that turns out to be the more important finding.
Key Takeaways
- SEBI’s October 2024 derivatives package and later changes created nine dated breaks that alter contract size, product availability, margin, costs and the expiry weekday. A single 2019 to 2026 backtest crosses all of them.
- On a weekly short-straddle proxy built from Nifty and India VIX, the average ratio of realized to implied move was 0.92 both before and after 20 November 2024. A break test found no significant change in average P&L (p above 0.9).
- That is not a green light. The 99 post-break weeks give a Sharpe estimate of 0.79 with a 95% interval of -0.62 to 2.33. Not one week saw a move above 3x the implied level, which chance alone would produce about one time in five.
- Contract value per lot rose about 3x, from ₹5.9 lakh to ₹18.1 lakh. Results quoted per lot cannot be compared across the break.
- The STT rise on premium sold adds only about ₹21 per lot to a weekly straddle in the proxy, while the worst post-break week cost about ₹66,400 per lot. Capital and tail risk matter more than the tax headline.
The Regime Timeline: Nine Changes Your Backtest Probably Ignores
A regime break is a date after which the market you are testing works differently. Here are the ones that matter for Nifty weekly options, in order.
| Date | What changed | Backtest input it breaks |
|---|---|---|
| 1 Oct 2024 | STT on options premium sold rose from 0.0625% to 0.1%, futures from 0.0125% to 0.02% | Cost model |
| 20 Nov 2024 | One weekly index expiry per exchange, so Bank Nifty weekly options ended. Extra 2% extreme loss margin on short options on expiry day | Product availability, margin |
| 2 Jan 2025 | First Nifty weekly expiry with lot size 75, up from 25 | Capital per lot, position granularity |
| Feb 2025 | Upfront option premium from buyers, no calendar spread margin benefit on expiry day | Margin, spread strategies |
| 1 Apr 2025 | Intraday monitoring of index position limits | Mainly large positions |
| 2 Sep 2025 | Nifty weekly expiry moved from Thursday to Tuesday | Calendar logic, day-of-week features |
| 6 Jan 2026 | Nifty weekly lot size cut from 75 to 65 | Position sizing |
| 1 Apr 2026 | STT on options premium sold rose to 0.15%, futures to 0.05% | Cost model |
| 1 Apr 2026 | SEBI’s retail algo framework became mandatory: static IP, daily login, 10 orders per second, market orders converted | Execution model |
Rows two to five come from SEBI’s circular of 1 October 2024 and the effective dates in SEBI’s July 2025 comparative study. The October 2024 STT change came from the Union Budget 2024. The expiry move comes from NSE’s circular as reported by Business Today, the 2026 lot size cut from a FYERS notice, and current STT rates from Zerodha’s STT page. Our guide to SEBI’s retail algo rules covers the last row in detail.
Did the Market Itself Change?
SEBI’s July 2025 study compared December 2024 to May 2025 with the same months a year earlier. Index options turnover fell 9% in premium terms and 29% in notional terms. The number of unique individual traders fell 20%, from about 84.1 lakh to 67.6 lakh, with the steepest drops among accounts trading under ₹1 lakh. SEBI itself notes that causality is hard to establish. Even so, the mix of participants on the other side of your trades changed, and a strategy that harvested their behavior is not guaranteed the same counterparties.
A Transparent Proxy: The Weekly Short Straddle
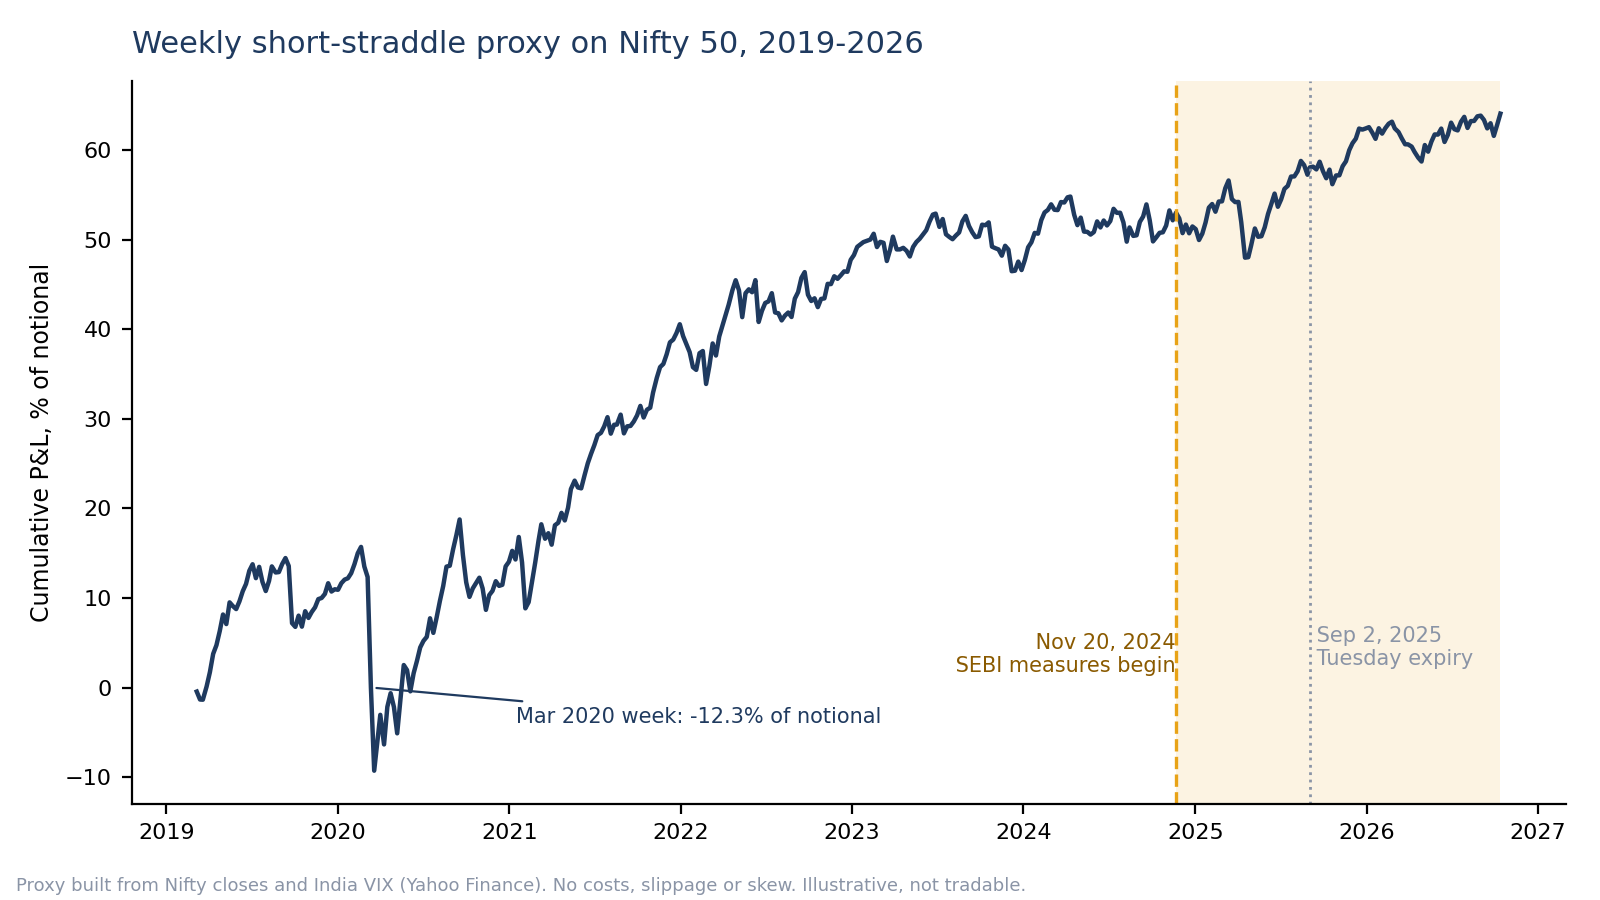
I built the simplest strategy that captures weekly option selling. At each weekly expiry close, sell an at-the-money Nifty straddle for the next expiry. Price it as 0.8 x India VIX x the square root of days to expiry over 365 x spot, then settle at the next expiry close. The scale-free measure is the ratio of realized move to implied move. A ratio below 1 means sellers kept some premium.
The limits are real. India VIX is a 30-day implied volatility, not a weekly one, and the proxy uses daily closes only, with no skew, slippage or brokerage. Treat the absolute levels as illustrative. The comparison between regimes is the point, because the same bias sits on both sides.
| Measure | Pre (Feb 2019 to Nov 2024) | Pre, excluding Feb to Jun 2020 | Post (Nov 2024 to Oct 2026) |
|---|---|---|---|
| Weekly cycles | 299 | 278 | 99 |
| Average India VIX | 18.0 | 16.6 | 14.1 |
| Mean realized/implied ratio | 0.92 | 0.90 | 0.92 |
| Profitable weeks | 65% | 66% | 60% |
| Mean weekly P&L, % of notional | 0.18 | 0.22 | 0.11 |
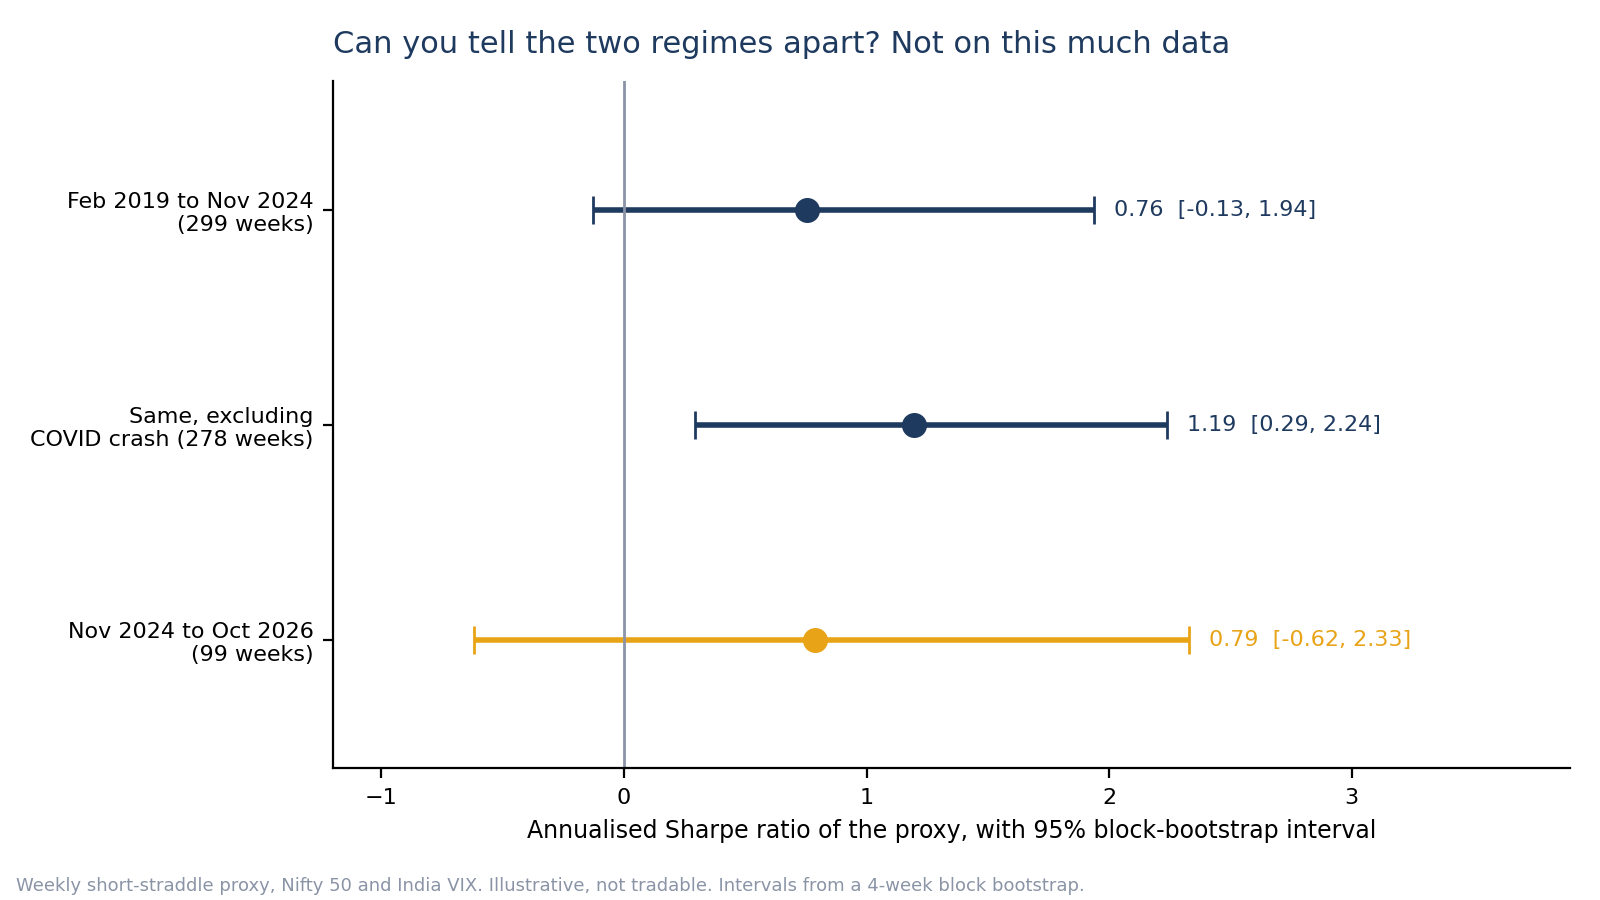
| Annualized Sharpe | 0.76 | 1.19 | 0.79 |
| 95% interval for Sharpe | -0.13 to 1.94 | 0.29 to 2.24 | -0.62 to 2.33 |
| Worst week, % of notional | -12.3 | -6.4 | -4.0 |
| Max drawdown, % of notional | 25.0 | 10.1 | 8.6 |
| Skewness of weekly P&L | -2.4 | -1.3 | -0.8 |
What did not change
The average edge looks the same. The ratio is 0.92 on both sides, and the difference has a 95% interval of roughly -0.16 to +0.16. A search for the most likely break date in the P&L found nothing significant (bootstrap p of 0.96 on the ratio and 0.93 on P&L). Average weekly P&L fell from 0.18% to 0.11% of notional, which tracks the lower premiums (average VIX 18.0 against 14.1) and not a weaker edge. The profitable-week share slipping from 65% to 60% is about one standard error, so it says little on its own.
What your data cannot tell you
The Sharpe estimate for the post-break sample is 0.79, but the 95% interval runs from -0.62 to 2.33. Andrew Lo’s 2002 result on the statistics of Sharpe ratios, as summarized by Bailey and co-authors, puts the standard error at roughly one over the square root of the years of data. For 1.9 years that is about 0.73, which matches the bootstrap. A strategy with a true Sharpe of zero and one with a true Sharpe of two are both consistent with this sample.
Event risk matters more than the regulatory changes in this proxy. Dropping the COVID months (February to June 2020, 21 cycles) moves the pre-break Sharpe from 0.76 to 1.19, a gap of 0.43. The gap between the pre and post regimes is 0.03.
The tail you have not seen yet
In the 99 post-break weeks, no week saw a realized move above 3x the implied move. Before the break, 5 of 299 weeks (1.7%) did. If that frequency still applied, a 99-week stretch with none would happen about 19% of the time. The worst post-break proxy week, 9 to 17 April 2025, lost 4.0% of notional at 2.6x the implied move. The March 2020 week came in at 5.8x. A post-break-only backtest therefore looks safer than the instrument is. We covered what SEBI’s loss data says about this in Does Algo Trading Really Work in India.
Lot Size, Capital and Costs: Where the Break Bites
On 19 November 2024, Nifty closed at 23,518.5. With a lot of 25, one contract was worth ₹5.88 lakh. On 2 January 2025, with the index at 24,188.7 and a lot of 75, it was ₹18.14 lakh, about three times larger. A backtest that sizes at “one lot” compares two very different positions. Report results as a percentage of notional or return on margin, and store the lot size by expiry date, since it changed again to 65 in January 2026.
The headline STT rise matters less than it looks for sellers. In the post-break proxy, the median weekly straddle collects about ₹24,500 per lot. STT on that premium is about ₹15 at 0.0625%, ₹25 at 0.1% and ₹37 at 0.15%, so the full increase adds roughly ₹21 per lot per week. The worst post-break week lost about ₹66,400 per lot, 2.7 times the median premium collected. Futures hedges feel the change more, since futures STT went from 0.0125% to 0.05%. Our piece on the hidden costs of algo trading covers the other charges that sit outside this proxy.
Do Expiry-Day Effects Move With the Expiry?
Using daily Nifty ranges, I divided each expiry day’s high-low range by the average range of the other days that week. Before the break the multiple was 1.02 (95% interval 0.96 to 1.08). In the Thursday period after the measures it was 1.04 (0.86 to 1.21), and in the Tuesday era 1.10 (0.98 to 1.22). At index level, expiry day was never dramatically wilder than other days, and the Tuesday reading sits at the edge of noise. Option-level behavior such as gamma and volume needs option-level data. Doyle and Chen’s 2009 study in the Journal of Banking and Finance found that weekday effects tend to wander over time, so avoid hard-coding a weekday feature across the break.
Why Short Samples Make Overfitting Easier
Bailey, Borwein, López de Prado and Zhu showed in the Notices of the American Mathematical Society that the data you need grows with the number of configurations you try. With only 5 years of data, no more than about 45 independent configurations should be tried, or you can expect an in-sample Sharpe of 1 from noise. With 2 years, that allowance falls to about 7. The post-break sample is 1.9 years long. Tune four knobs with three values each (entry time, strike offset, stop multiple and a VIX filter) and you have 81 combinations. They are not fully independent, but the rule of thumb shows how little room two years leave.
A Regime-Aware Backtest Protocol
- Write the regime table first. List every dated change that touches your instrument before writing code.
- Store point-in-time inputs. Keep lot size, STT, expiry weekday, available products and margin rules by date, never today’s values.
- Normalize results. Report percent of notional or return on margin, not rupees per lot.
- Show pre, post and combined results with intervals. One Sharpe number hides the uncertainty.
- Count your trials. Record how many configurations you tested and compare against the minimum backtest length guidance above.
- Replay tail weeks. Inject March 2020, September 2019 and April 2025 into the post-break sample and check the drawdown.
- Forward test small. Run live at minimum size for a pre-agreed number of weeks, with stop rules written in advance. Include the execution rules, since static IP, daily login and market order conversion change fills. Our post on common algo trading mistakes explains why a clean backtest is an estimate, not a promise.
Final Thoughts
The lesson is not that older backtests are wrong. A backtest from 2019 to 2024 answers a question about an instrument that no longer exists in that form. The average edge in our proxy looks stable, but the contract is three times larger, the weekly menu is shorter, costs are higher, and two years of data cannot confirm that the edge survived or that the tail has gone quiet. Treat regime breaks as inputs to your model, not footnotes to your results.
This article is for education and is not investment advice. The proxy is a simplified illustration built from daily Nifty and India VIX data, not a tradable backtest, and derivatives trading carries a high risk of loss.